
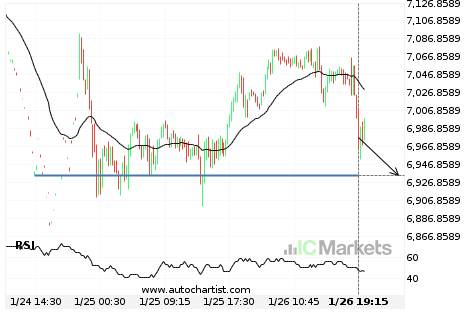
Breach of important price line imminent by Australia 200 Index
Australia 200 Index is moving towards a line of 6934.7202 which it has tested numerous times in the past. We have seen it retrace from this position in the past, so at this stage it isn’t clear whether it will breach this price or rebound as it did before. If Australia 200 Index continues in […]
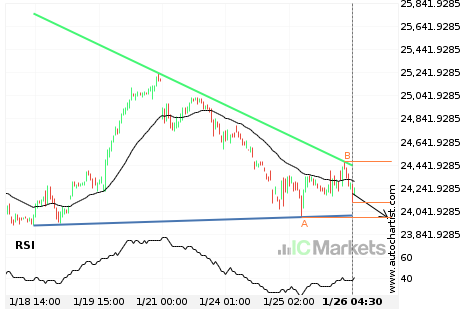
Either a rebound or a breakout imminent on Hong Kong 50 Index
Hong Kong 50 Index is heading towards the support line of a Descending Triangle. If this movement continues, the price of Hong Kong 50 Index could test 23992.2000 within the next 2 days. It has tested this line numerous times in the past, so this movement could be short-lived and end up rebounding just like […]
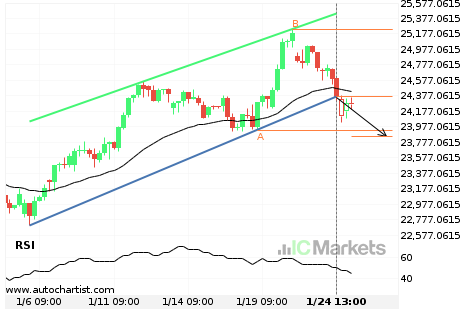
Hong Kong 50 Index has broken through support
Hong Kong 50 Index has broken through a support line. It has touched this line at least twice in the last 19 days. This breakout may indicate a potential move to 23852.4449 within the next 3 days. Because we have seen it retrace from this position in the past, one should wait for confirmation of […]

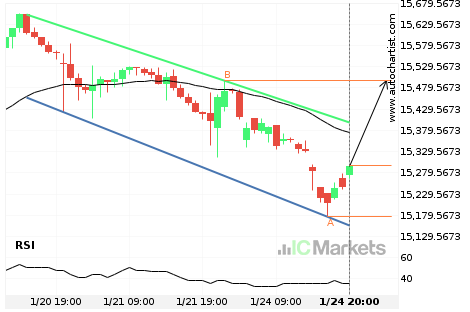
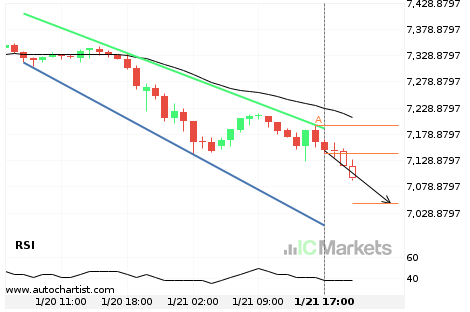
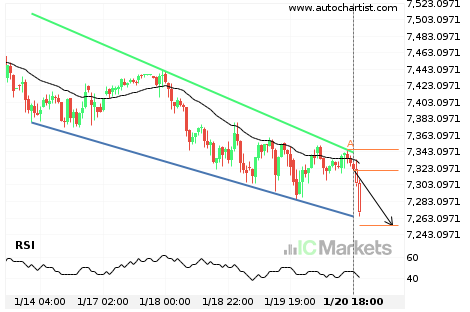
Will FTSE China A50 Index have enough momentum to break resistance?
FTSE China A50 Index is heading towards the resistance line of a Channel Down and could reach this point within the next 14 hours. It has tested this line numerous times in the past, and this time could be no different from the past, ending in a rebound instead of a breakout. If the breakout […]
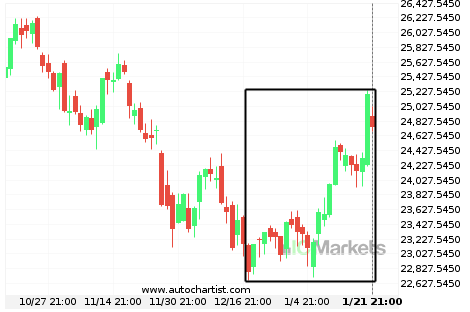
Where is Hong Kong 50 Index moving to?
A movement of 8.6% over 34 days on Hong Kong 50 Index doesn’t go unnoticed. You may start considering where it’s heading next, a continuation of the current upward trend, or a reversal in the previous direction.
Australia 200 Index approaching support of a Channel Down
Australia 200 Index is approaching the support line of a Channel Down. It has touched this line numerous times in the last 2 days. If it tests this line again, it should do so in the next 7 hours.

Australia 200 Index approaching support of a Channel Down
Australia 200 Index is approaching the support line of a Channel Down. It has touched this line numerous times in the last 2 days. If it tests this line again, it should do so in the next 7 hours.
Australia 200 Index approaching support of a Falling Wedge
Australia 200 Index is approaching the support line of a Falling Wedge. It has touched this line numerous times in the last 7 days. If it tests this line again, it should do so in the next 2 days.

Australia 200 Index approaching support of a Falling Wedge
Australia 200 Index is approaching the support line of a Falling Wedge. It has touched this line numerous times in the last 7 days. If it tests this line again, it should do so in the next 2 days.